Melanoma Recognition via Visual Attention
Published:
Paper (preprint)
Paper (camera ready)
IPMI 2019 poster
Code
Network architecture
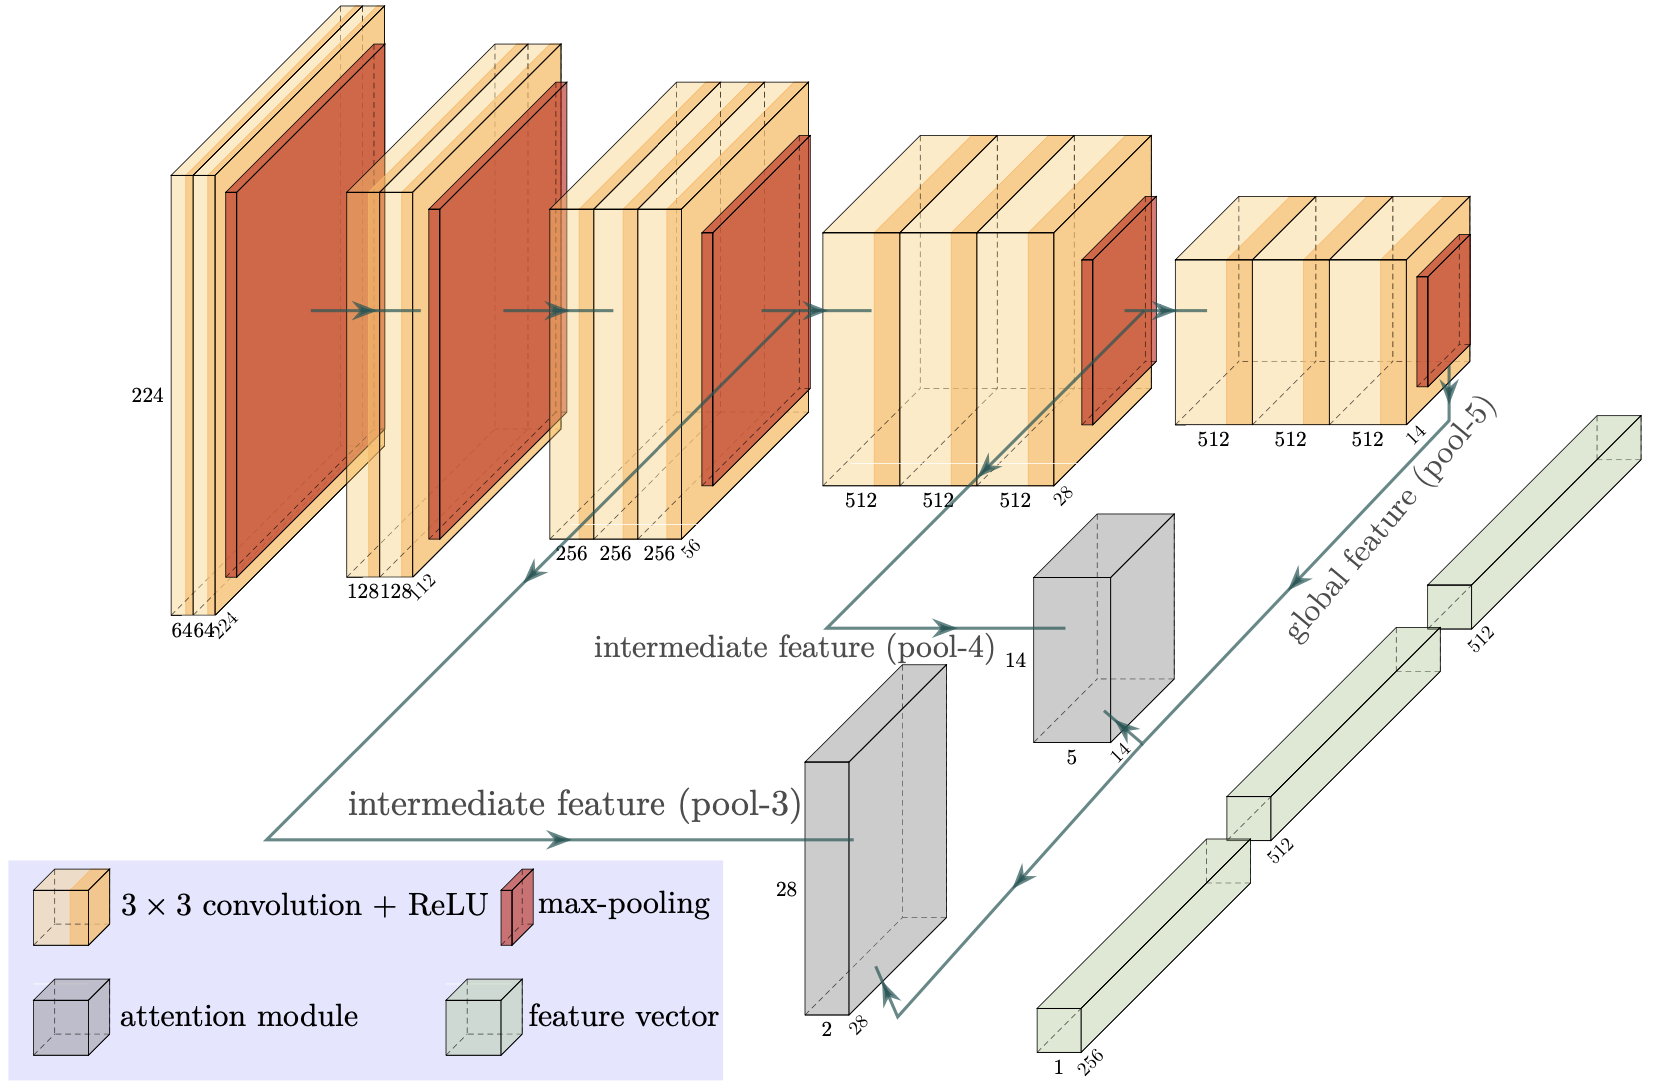
The backbone network is VGG-16 (the yellow and red blocks) without any dense layers. Two attention modules are applied (the gray blocks). The three feature vectors (green blocks) are computed via global average pooling and are concatenated together to form the final feature vector, which serves as the input to the classification layer. The classification layer is not shown here. For more details please refer to the paper.
Melanoma Recognition Performance
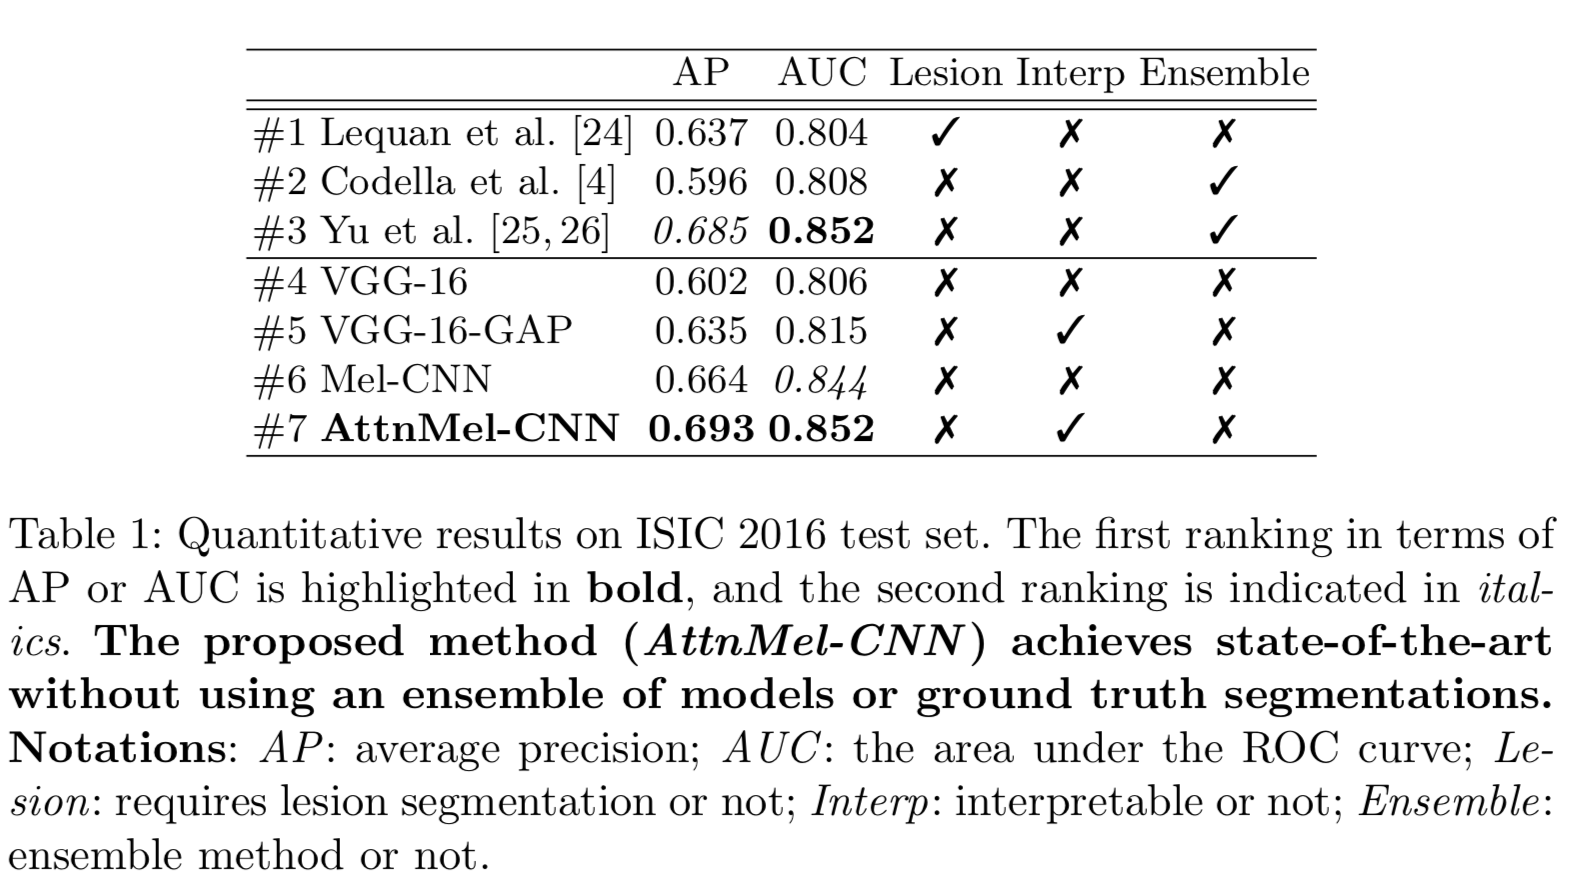
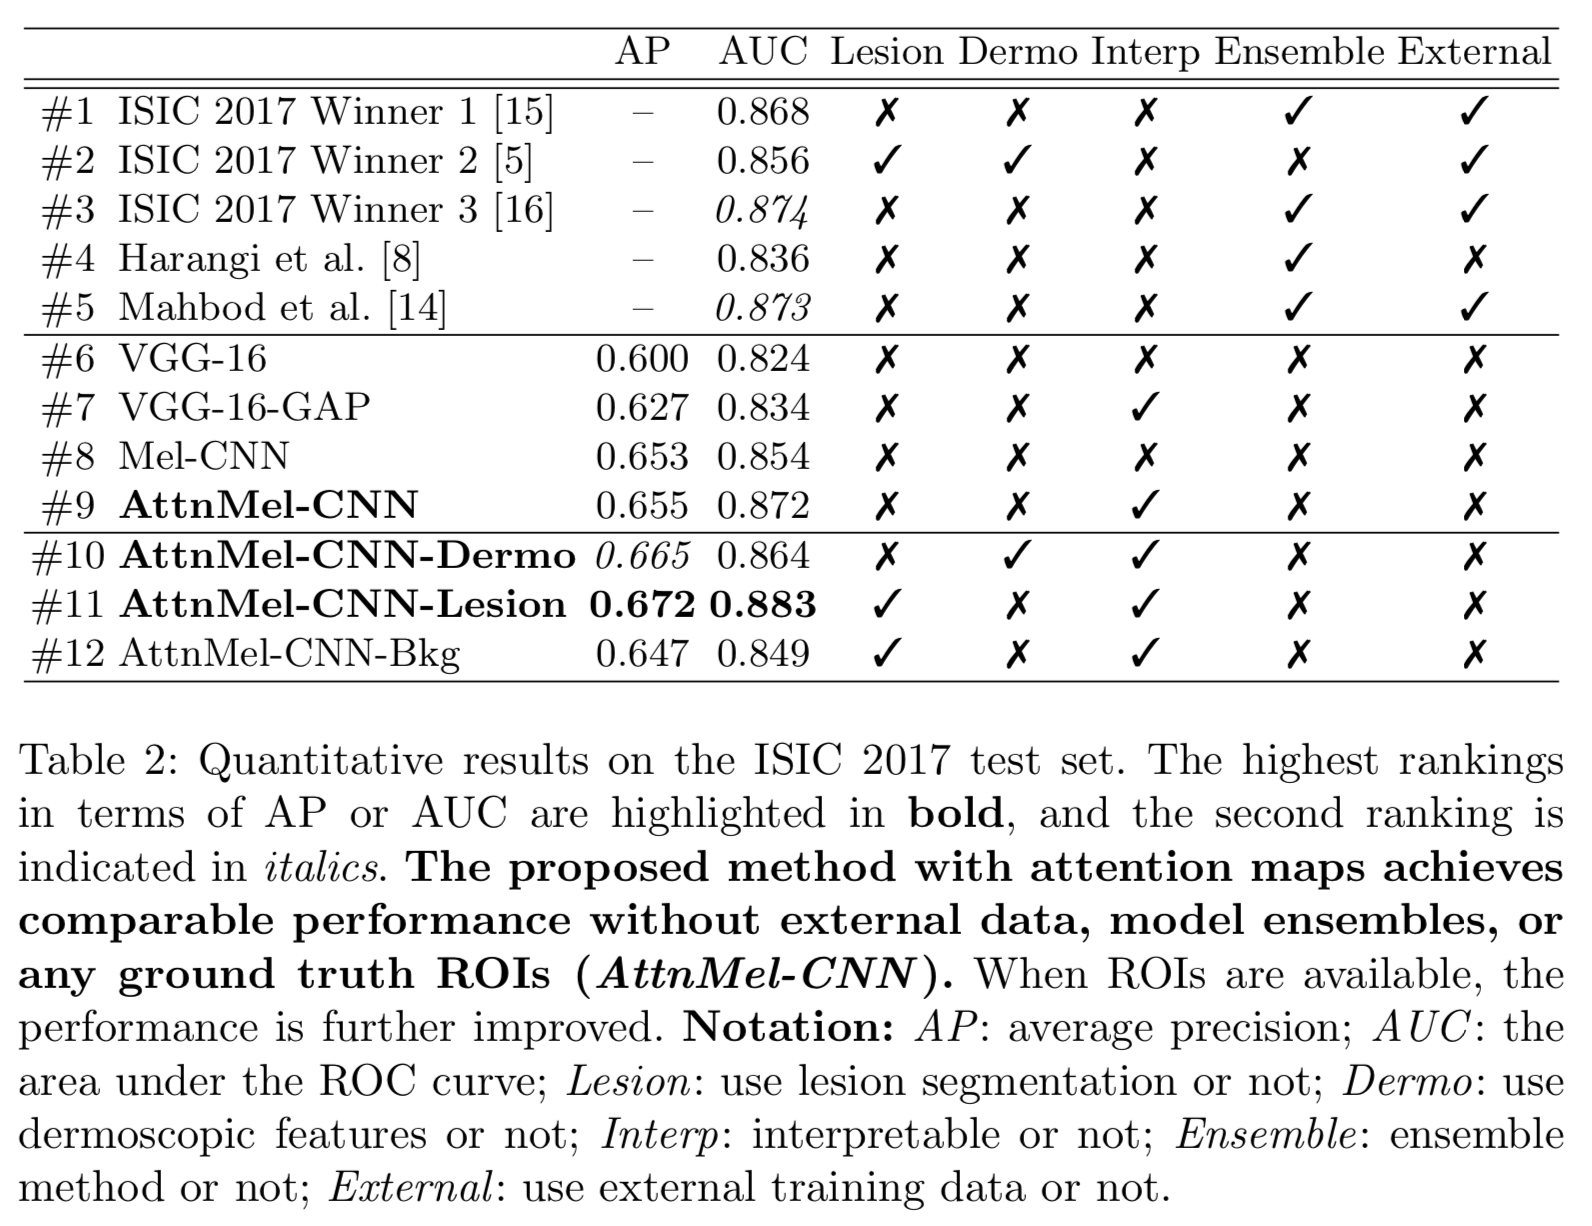
We perform ablation study to explore the effectiveness of visual attention. We also compare with previous method. For experimental details, please refer to the paper.
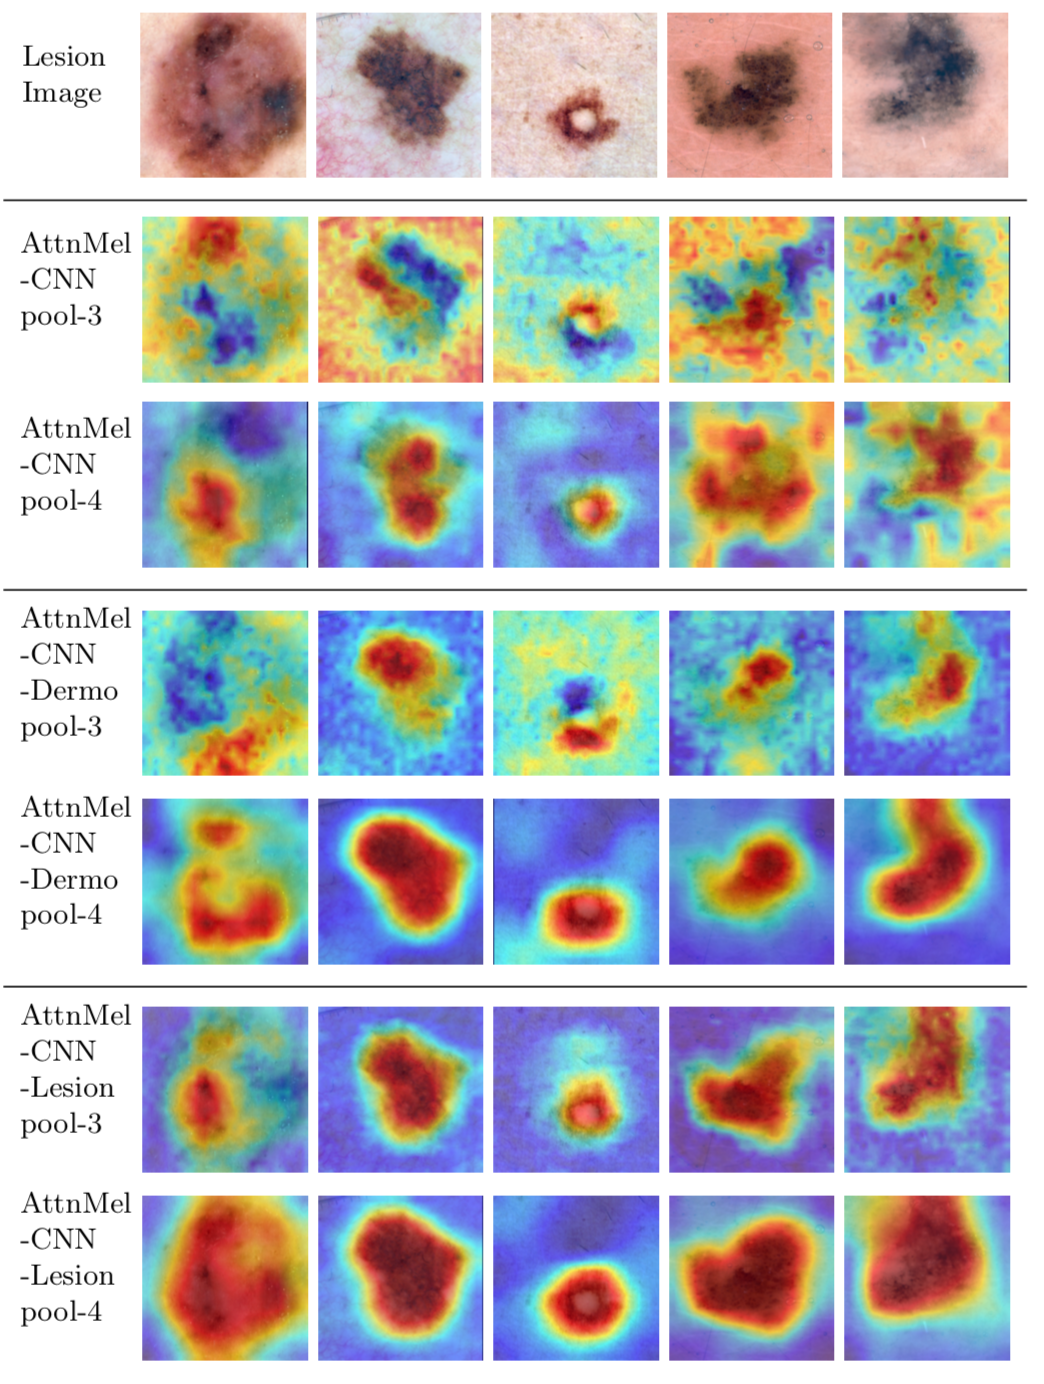
Qualitative Analysis of Attention Maps
- The deeper layer (pool-4) exhibits more concentrated attention to valid regions than the shallower layer (pool-3).
- The models with additional regularization (rows 4-7) produce more refined and semantically meaningful attention maps, which accounts for the accuracy improvement.
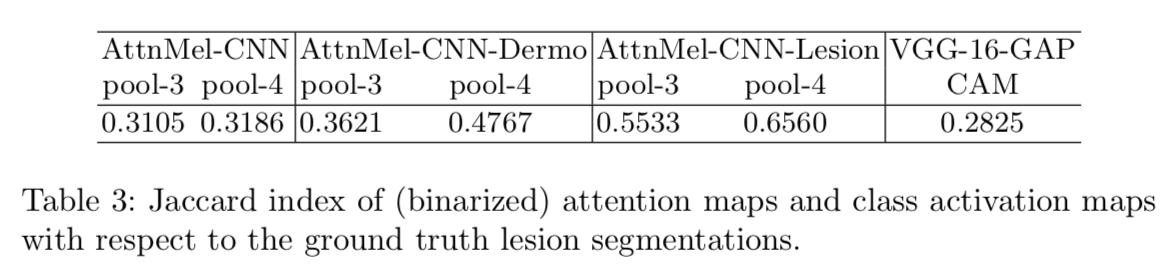
Quantitative Analysis of Attention Maps
We quantify the “quality” of the learned attention map by computing its overlap with the ground truth lesion segmentation. First, we re-normalize each attention map to [0,1] and binarize it using a threshold of 0.5. Then we compute the Jaccard index with respect to the ground truth lesion segmentation.